Turtle Games: Leveraging Customer Trends for Improved Sales Performance
- Matteo Natalini
- Sep 16, 2023
- 5 min read

Updated: Dec 4, 2023
Programming languages: Python, R
Analytical techniques: Linear Regression, k-means Clustering, Natural Language Processing (NLP)
Link to the repository with the code and technical report in GitHub
Overview
Turtle Games is a leading global game manufacturer and retailer. This analysis will cover key objectives that Turtle Games wants to explore, including customer loyalty point accumulation, market segmentation through customer groups, utilisation of customer reviews for marketing campaigns, the impact each product has on sales, and the relationship between North American, European, and global sales.
Analytical approach
Using a combination of statistical techniques and machine learning, we will answer important business questions, such as predicting loyalty points based on customer characteristics and targeting specific market segments using customer groups.
Additionally, we will utilise Natural Language Processing to gain insights from customer reviews and inform our marketing campaigns.
We will examine global sales trends through compelling visualisations in R and analyse the relationship between North American, European, and global sales data to make accurate predictions.
Visualisations and insights
a. Linear regression models
Our first task is to examine how customers accumulate loyalty points and identify any patterns. We analysed the correlation between the loyalty points earned by customers and their spending scores. The spending score is a value ranging from 0 to 100 assigned by Turtle Games based on the customer's spending habits and behaviour.
We created a linear regression model, and the red line represents the best fit, which predicts the loyalty points earned based on a customer's spending score. We observed that for customers with a spending score between 40 and 60, loyalty points increase as the spending score increases, suggesting a strong correlation. However, this correlation is lost beyond 60 points, and no pattern is noticeable. Below 40 points, there is some correlation, but many values fall above or below the best-fit line.

We then investigated whether customers' annual income affects the accumulation of loyalty points. We found a positive correlation between the two variables, which is significant until the income reaches 58,000 pounds. It is worth noting that although our predictions may not be accurate for customers with higher incomes, we observed that the values can be divided into two main groups, and the top group still shows a positive correlation. It is likely that identifying and incorporating additional customer characteristics would result in improved prediction accuracy.

b. Clustering
To identify smaller groups within our customer population that share similar characteristics, we investigated the correlation between income and spending score. Through the use of clustering techniques, we were able to identify five groups that exhibit similar behaviour. The most populous cluster is the central group, with incomes ranging from 30 to 58k and a well-defined spending score range. Conversely, the extreme groups exhibit a steep separation between clusters, similar to what we observed in previous graphics. These groups may help us divide customers into smaller categories and build models that provide more accurate predictions. Cluster 2 is likely to be that part of a group of customers with high credit, which we found to have a high correlation with loyalty points.

c. Customer reviews analysis
In the following section, we will examine the insights we can gain from a capillary analysis of customer reviews. In this graph, which resembles pop art, we can observe the most commonly used words by our customers. While the words themselves may not provide much information, when we use natural language processing tools to apply a sentiment score, we can determine the customer's feelings associated with these words.

The sentiment score is measured on a scale ranging from 1 (positive) to 0 (neutral) to -1 (negative). Based on the bar chart, the overall sentiment appears to be mostly neutral but leaning towards the positive side, which is a positive indication.

Based on the most frequent words used in reviews, here are some recommendations for a marketing campaign:
Highlight the fun factor: Since "fun" is one of the most frequently used words, it's important to showcase the entertainment value of the games. You can use this word to emphasise the joy and excitement that customers can experience while playing your games.
Emphasise positive reviews: The words "great", "good", "love", "like", and "awesome" are all positive adjectives commonly used in reviews. You can use these words to emphasise the positive feedback from satisfied customers.
Target kids and families: The words "kids" and "cute" suggest that your games are popular among children and families. Highlighting the child-friendly aspects of your games can help attract parents who are looking for fun and educational activities for their kids.
Offer expansions and sets: The word "expansion" suggests that customers are interested in building on their existing collections. Offering expansions and sets for popular games can be an effective way to upsell customers and increase revenue.
Leverage nostalgia: The word "old" suggests that customers may be interested in retro or vintage games. Highlighting classic games or offering retro-themed merchandise can be an effective way to appeal to customers who are looking for a nostalgic experience.

d. Sales Analysis
Let's take a closer look at our sales data and see how our products impact our global sales. Here, we have a boxplot that displays the distribution of sales across platforms worldwide. We can notice a prominent outlier in the Wii box plot, and upon further investigation, we discovered that it's a sports game from 2006 that has sold exceptionally well, with over 60 million pounds of revenue globally. Compared to our other games, that's definitely a bestseller!

This chart shows worldwide sales categorised by genre, with each platform represented by a unique colour. It's clear that certain genres are more popular on specific platforms. For example, action games are preferred on PS platforms, and shooter games are equally popular on PS platforms and X360. In contrast, sports games are dominated by the Wii.

The following chart displays a comparison of platform sales in various markets. It's interesting that even if the top three platforms in the three categories are the same, the order of preference varies geographically. Globally, Wii generates the most revenue, followed by X360 and PS3. In Europe, Wii is the top platform, too, but it is followed by PS3 and X360. In North America, X360 is the preferred platform, followed by Wii and PS3. Therefore, appropriate targeting based on location is necessary.

e. Global sales prediction
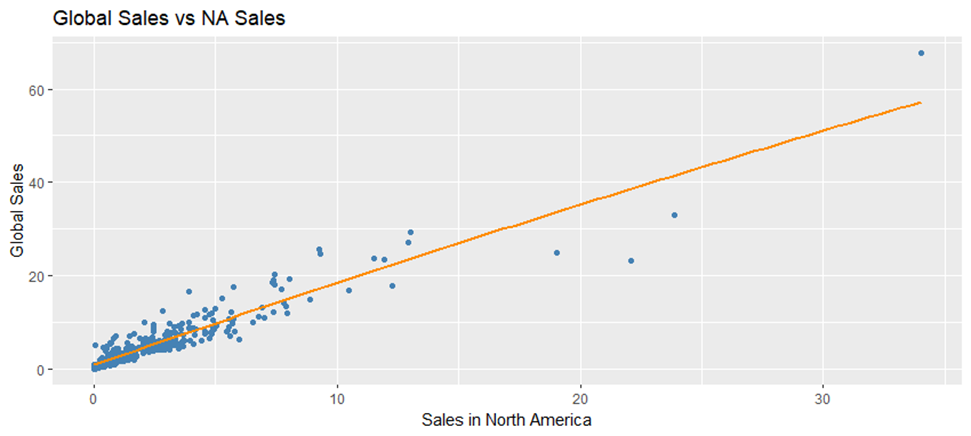
Based on the graphs below, it is evident that there is a strong and positive correlation between global sales and sales in North America and Europe. This suggests that these two factors can be utilized to create a reliable model for predicting future global sales. Our team was able to successfully create and test a model that uses North American and European sales data as inputs to predict global sales with a fair level of confidence.

Recommendations
It would be beneficial to conduct further investigation to determine which customer groups are most affected by loyalty programs. Our analysis revealed interesting trends among income groups, and with additional research and data, we could potentially increase revenue by targeting the appropriate customer groups.
To have more recent sales data to predict future sales trends, it would be advantageous, ideally in chronological order, to perform a time series analysis.
It is common knowledge that Europe and North America are the wealthiest regions and dominate the market, accounting for a significant portion of global sales. However, it would be beneficial to gather more information about other regions involved in global sales in order to identify opportunities to expand sales and target countries that are becoming increasingly significant players in the industry due to their rising wealth.
Conclusions
We saw how remuneration and spending scores could be useful in identifying groups of customers that can be targeted in loyalty programs.
We gained precious information on topics that interest the most of our customers, and such topics should be used in the marketing campaigns.
We recognised the all-time best seller and saw how it compares with the rest of the market.
We have also determined which platform is most popular for the top genres and have identified the best-selling platforms in different regional markets. This information can guide marketing decisions in various geographical areas.
To conclude, we have discovered a strong correlation between sales in Europe, North America, and globally. Additionally, we have developed and successfully tested a robust model that enables us to predict future global sales based on input from the other two regional sales.


Comments