2Market: Data Analytics for Business
- Matteo Natalini
- Sep 16, 2023
- 3 min read

Updated: Sep 18, 2023
Programming language: SQL
Tools utilised: Excel, PostgreSQL, Tableau.
Link to the dashboard on Tableau Public here
Overview 2Market is a global supermarket that offers both online and in-store shopping. The company aims to understand better its customers, their purchase habits, and the relationship between advertising and sales. This information will help 2Market improve its marketing strategies.
Analytical approach
This analysis aimed to gather comprehensive information about 2Market's customers, including their demographics and preferences, to identify segments of interest. The main objective is to use this information to guide future marketing campaigns effectively. The outcome will be a user-friendly dashboard, accompanied by detailed recommendations, that will help stakeholders make informed decisions.
Cleaning the customer information was performed in Excel and involved several steps. These included ensuring a consistent data format, eliminating duplicate rows, addressing outliers and checking for errors. I then started the initial explorative analysis, looking at descriptive statistics and gaining insight through some basic visualisations.

It emerged that most customers are between 40 and 70 years old, with an average age of 53.
The next step involved analysing how income varies with age. The analysis revealed a positive trend between age and average income. Interestingly, customers between the ages of 76 and 85 have the highest average income. However, on average, customers who are 43 years old tend to earn the most.


The explorative analysis of the sales data has been performed in SQL. Calculating the total spending per Country, it emerged that Spain has the highest. Although Montenegro has the highest expenditures per capita.

Analysis of the purchases across different categories shows similar results, with alcoholic beverages being the best sellers, followed by meat.
The analysis of marital status reveals that couples spend the most, suggesting that they use 2Market for family groceries.

Joining marketing and advertising data, the effectiveness of different advertising channels was investigated, considering as a measure of effectiveness the total number of lead conversions, which represents the turning of potential customers into paying customers.

Most effective advertising method per Country
Further calculations were performed to determine the total spending generated by customers obtained via different social networks in various Countries and their percentage contribution to overall expenditures.

Which social media platform is the most effective by Country

Dashboard design and development
The dashboard comprises three sections: customer demographic overview, purchasing behaviour and advertising channel effectiveness. (Link to the dashboard here)

Clicking on the categories makes it makes it possible to filter the data in the whole dashboard, so that it is possible to see the demographic characteristics of specific types. It is possible to add multiple filters, i.e. divorced people with a Master's degree from Canada.
The second dashboard shows the most popular products and the most effective marketing channel globally.

Here are listed the total spend per different groups of customers to identify the categories that spend the most. Clicking on such categories makes it possible to filter the data and see their specific top sellers and their most effective marketing channels.
The last dashboard shows how marketing channels affect different groups of ages, and how other countries are exposed to social media.
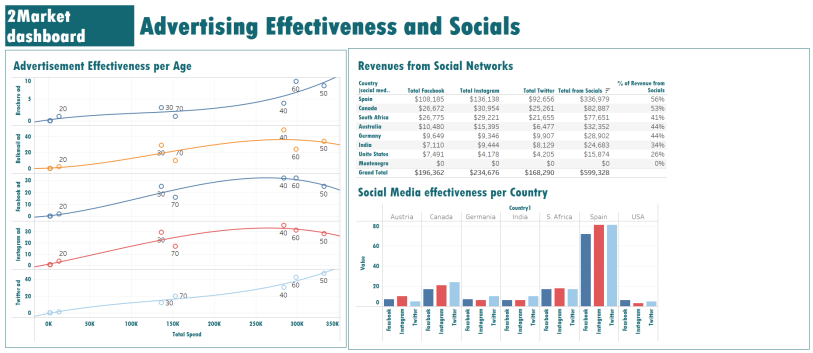
It's also possible to see the revenues generated by every social network and in what percentage they affect the total revenues.
Patterns, trends, and insights
Although the average income seems to increase with the age of customers, the under 30 gain more than the average and detain the highest spending per capita. This makes them a category of interest.
Globally, the best seller is alcoholic beverages, followed by meat. Considering deals with alcoholic beverages could improve sales, for example, the suggestion of snacks at the check-out or wine-paired foods such as cheese and charcuterie.
The advertising channel delivering the most lead conversions is Twitter, followed by the bulk mail method. If we look at the revenues generated by social media, we can see Instagram is at the lead, generating more than 19% of the total, followed by Facebook and Twitter. Instagram is the most effective channel for married customers, which generates the highest part of the total spending and the under 30, which, as said before, is a category with a high purchasing power. The suggestion is to improve social advertising, targeting the proper range of ages with each channel. Twitter works well with customers over 50, which are the ones who spend the most.
Considering the revenues generated by social lead conversions are almost half of the total, it is worth trying to reach countries where social media is still not very effective, which is the case in India and the USA, and to consider using more platforms such as TikTok and Snapchat.


Comments