NHS: Staffing and Resource Utilisation Analysis for Network Operations
- Matteo Natalini
- Sep 16, 2023
- 5 min read

Updated: Nov 13, 2023
Programming language: Python
Analytical techniques: Time Series Analysis
Link to the Jupyter Notebook: Github
Overview
The goal is to analyse historical data of all appointments at general practitioner (GP) surgeries in England to identify trends that can help reduce avoidable costs of missed appointments. Currently, the focus is on two main questions raised by the NHS: whether there are enough staff and resources available in the networks and how effectively these resources are being utilised.
Analytical approach
Python programming language will be the tool for the task. It allows to efficiently perform descriptive and diagnostic analysis of large datasets and create high-standard visualizations using libraries such as pandas, matplotlib, and seaborn. To enhance the research, external data has been incorporated from the social network Twitter to gather information on the general public's sentiment towards the NHS. In order to enhance our efficiency, we utilized GitHub for storing our code and reports. This approach enables the team to work collaboratively on the most recent material, promoting real-time teamwork.
a. Import and explore the data
Using Python and Pandas, I analysed three datasets with the NHS's historical appointment data. The datasets were checked for missing values and successfully imported. during the exploratorive analysis I identified the number of locations and which service settings was the one with more appointments. It has been found that November has the highest number of appointments, while August has the lowest. This trend appears to be related to the holiday season, as both December and August have low numbers of appointments.
b. Visualisation and insights
Seaborn and Matplotlib libraries were utilised to create visualizations and plots in order to investigate further the trends discovered in the exploratory phase. The analysis indicated that General Practice had the most appointments, but interpreting it accurately was difficult due to the significant difference in the number of appointments from the other service settings (Fig. 1). To gain a clearer understanding, we isolated the other services in Fig. 2. The data revealed that General Practice experienced a spike in appointments during October, November, and March, without any growth over time. On the other hand, Extended Access Provision and Primary Care Networks displayed a rising trend, with noticeable peaks in November, March, and May.

Figure 1
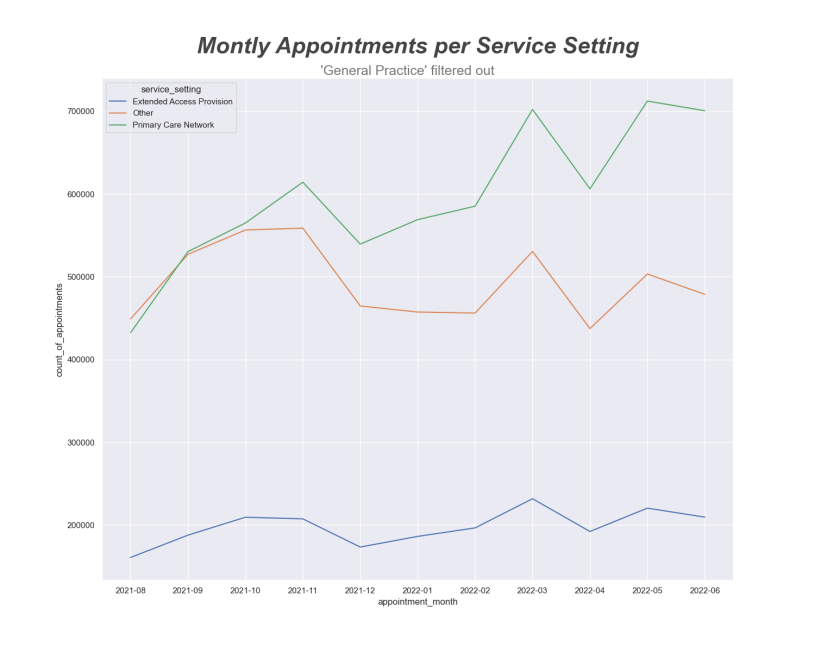
Figure 2
Our investigation has shifted towards exploring national appointment categories. Due to the abundance of categories, I have chosen to focus on the one with over 200,000 appointments. In Figure 3, we can observe that general consultation routines are the most sought-after, followed by general consultation acute and clinical triage. The category with the most prominent surge in October is planned clinical procedures, while all categories experience a peak in November, March and May.

Figure 3
According to the chart, there has been a significant increase in the number of scheduled clinical procedures during the month of October, which we previously noted as being the second busiest month of the year. Based on this data, it may be advisable for the NHS to consider avoiding a heavy workload during October and scheduling procedures during less busy times whenever possible.
c. Twitter data analysis
The goal was to discover hashtags in tweets and determine the most popular ones. By utilising Twitter data, the NHS can gain a more thorough understanding of their patients and their attitudes toward them. The majority of the words in the top ten pertain to the NHS, with "healthcare" being the most frequently used. However, we also observed "ai" and "digitalhealth" in the top ten, indicating a growing interest in how technology and healthcare can merge.

Figure 4
d. Resource utilisation analysis
We know that the NHS has a maximum daily capacity of 1.2 million appointments. Examining the average daily capacity per month it's possible to determine if this limit is ever exceeded. While the chart indicates that the maximum network capacity is never reached, it is important to note that we are only analysing the average and cannot determine if there are any individual days where the limit is met (Fig.5).

Figure 5
After conducting a thorough analysis of the busiest month of the year emerged that the limit is consistently exceeded on weekdays and decreases towards the end of the week. (Figure 6)

Figure 6
I also examined the quieter month of the year and found that the limit is reached every Monday (Fig.7). Based on these findings, I recommend that the NHS consider implementing policies that encourage visits to be spread out throughout the week, with a focus on the end of the week.
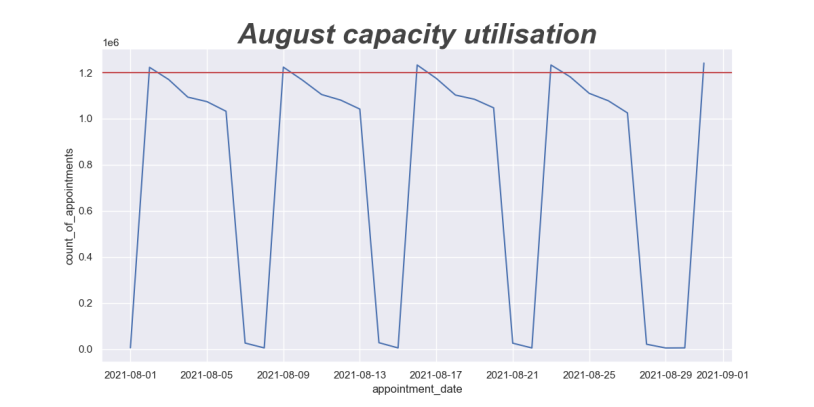
Figure 7
e. Healthcare professional analysis
The healthcare professionals can be divided into two categories: General Practitioners and other professionals. According to the graph, GPs are generally busier than other professional types, except for October (Fig.8). Additionally, I observed that appointments made with non-GPs have a higher rate of missed appointments (Fig.9). Therefore, it may be beneficial to further investigate this trend by dividing this large category into individual professional types.

Figure 8

Figure 9
f. Appointment types analysis
The chart displays the behaviour of different appointment types over time. Face-to-face appointments have the highest number, followed closely by telephone consultations, which exhibit a consistent pattern throughout the year. On the other hand, video/online appointments have a significantly lower count, and the NHS needs to explore strategies to improve this. It's worth noting that telephone visits have a higher count and display consistency throughout the year. This ties back to our earlier Twitter research, which indicates a growing interest from the public in the integration of technology and healthcare.

Figure 10
g. Service setting and spread of appointments
After analyzing the spread of appointments across different service settings, it became evident that General Practitioners were the most frequently used service in the network (Fig.11). When evaluating the other services individually, we observed a significant variance in the unmapped data (Fig.12). Enhancing the mapping of these appointments will allow for more comprehensive analysis, enabling us to track the progress of other service settings like Primary Care Network, which is already in the vision of the NHS.

Figure 11

Figure 12
Conclusions
The busiest months have been identified (October, November, and March) and in which month NHS should avoid planned clinical procedures (October).
The most missed appointments are the ones booked with a healthcare professional who is not a GP. NHS should investigate in more depth which particular healthcare professionals these are in order to discover why.
Telephone visits are consistent throughout the year and also during the busiest times. Therefore, NHS should look at how to increase their video appointments in line with the popular Twitter hashtags.
The average data showed that the maximum utilisation capacity of appointments was exceeded and NHS should look at its implemented policies to spread the appointments evenly throughout the week to avoid unnecessary workload.
The primary care network has the potential to improve the whole NHS network and its utilisation is rising. Improving the mapping in future data collection should be promoted in order to perform better analysis and follow the development of such different service settings.


Comments